Understanding the Market Structure
Tip
If you are already familiar with the market design and just want to read about the data, skip this page.
Compared to other countries, Australia's electricity market is very simple. Other markets can feel like this:
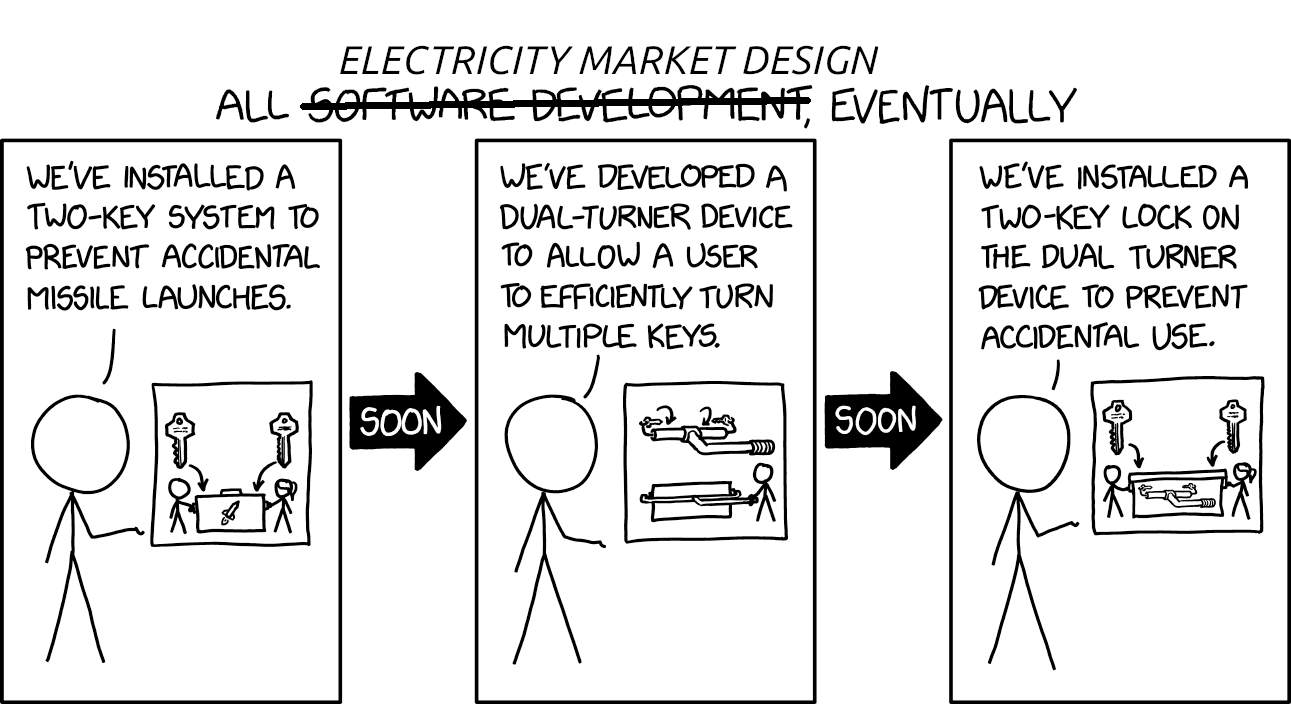
For example, Germany cannot directly subsidise renewables, because of EU state aid laws. So the government offers contracts for difference (CfDs) to shield investors from the risk of low wholesale prices. They block low price signals from reaching generators by inserting the taxpayer's wallet in the middle. The generators respond to the artificially-high prices which they see in the way you would expect any business to, by producing more. This drives the wholesale price down, which causes fossil fuel generators to produce less, which is the point of the policy. However the government does not like prices below zero, so they added carveouts to halt CfD payments during negative prices. Now solar/wind investors are re-exposed to the risk of low prices, even though shielding them from that risk is why these CfDs were created.
Australia's market is far simpler. The NEM is an "energy only" market. (Well, almost. The federal and state governments keep fiddling with the nicely designed market by adding some capacity products, CfDs and other patchwork schemes. See my master's thesis for an explanation of why capacity markets are unnecessary in a market with such a high ceiling price.) There is no day-ahead market. AEMO publishes forecasts every 5 minutes which guide the market participants, and then everyone is paid (or pays) the one energy price.
A note on terminology: where academic economists say "supply" and "demand", in the industry we tend to say "generation" and "load".
Prices
Energy prices have a legally defined maximum "ceiling". This is indexed each year, and is currently around 20,000 $/MWh. This is far higher than most countries. (To understand why this is a great thing, see my master's thesis.)
The minimum is below zero, at -1000 $/MWh (not indexed). Yes, prices can go negative. South Australia has the most negative electricity prices in the world. It is unusual to have a day in Australia without negative prices at some point. From a data science perspective, this means that taking logarithms of the price to do regressions does not work.
Electricity prices are very volatile. Price and revenue data is highly skewed. Outliers are of central importance. For example, it is normal for a generator to make as much profit in the top 10% highest-priced hours each year as the rest of the year combined. (I show this with an example query later.) I have seen a consultant's report commissioned by AEMO where they simply deleted intervals with negative prices and very high prices. Do not do this. This is incorrect and will give you meaningless results.
The market is "pay-as-cleared", not "pay-as-bid". This is true of energy and FCAS.
Predispatch is Not a Day-Ahead Market
Tip
The NEM does not have a day-ahead market.
"Trading days" start in the 4:00-4:05 interval, and finish in the 3:55-4:00 interval the next calendar day. Participants need to submit bids each trading day by 12:30pm. They can submit bids much further in advance. If no bids are submitted for a given day, AEMO copy-pastes the last bid which was submitted for that participant. AEMO takes these bids, and a prediction of load, rooftop solar output etc, and runs the same code they use for the actual real-time dispatch, but in advance. From this they can predict prices, and the power flows from each generator, across each transmission line, whether constraints are binding etc. This is called "predispatch". (Whereas "dispatch" is the actual live instruction and price every 5 minutes.) This prediction is updated every 5 minutes, for the next 24-48 hours. (The specific tables are described later.)
The crucial thing to understand here is that this is merely a prediction for planning purposes. No generator is paid at the predispatch price, so it is not a real price, nor a real market.
The 12:30pm cutoff is not as important as it sounds. After the 12:30pm cutoff, generators can still "rebid". The only two restrictions on "rebids" vs "bids" are:
- Rebids must have a justification (a letter to represent a category, and a sentence), although in practice this is often as vague as "Changed market conditions".
- A bid is a spreadsheet where each row is a time interval (288 5-minute intervals), and each column is a "price band". The price of each price band cannot be changed after the 12:30pm cutoff. However participants can still shuffle quantity between bands. With 10 bands, that is a lot of flexibility.
Rebids can be submitted at any time. There is no "gate closure". For example, a generator can submit a rebid at 01:04:50 for the interval 01:05-01:10, and it will be accepted. (There are a few seconds of lag for IT reasons, not regulatory ones. So 01:04:59 may be too late.) From 01:50:00 AEMO will start their calculations based on all the bids and other information they have. They will publish dispatch instructions (power levels) and prices around 01:05:10 to 01:05:40. (Note that technically AEMO tells generators what to do several seconds after they are supposed to have started doing it.)
The timeline for bids and rebids is explained by Watt Clarity. Bid data is discussed in more detail later. If you want a more cite-able source about the lack of a day-ahead market, check out this interesting paper by Gilmore, Nolan and Simhauser, where they estimate the levelised cost of FCAS.
Two-Dimensional Time
AEMO's data often contains predictions of the future. e.g. price, power flows, constraint binding. These predictions are updated often, yielding a history of different versions of predictions which apply to the same interval. In the data this means you may see two datetime columns. This kind of data is sometimes called "bitemporal" data.
Here is a screenshot of a paid application called ez2view (which takes MMS data and displays it graphically), by a company called Global Roam (the authors of Watt Clarity). The screenshot is from this article. Each cell in this table is a prediction of price from predispatch. Each column is a time interval which the prediction applies to. Each row is a time when the prediction was made. The screenshot graphically shows how predictions changed over time.
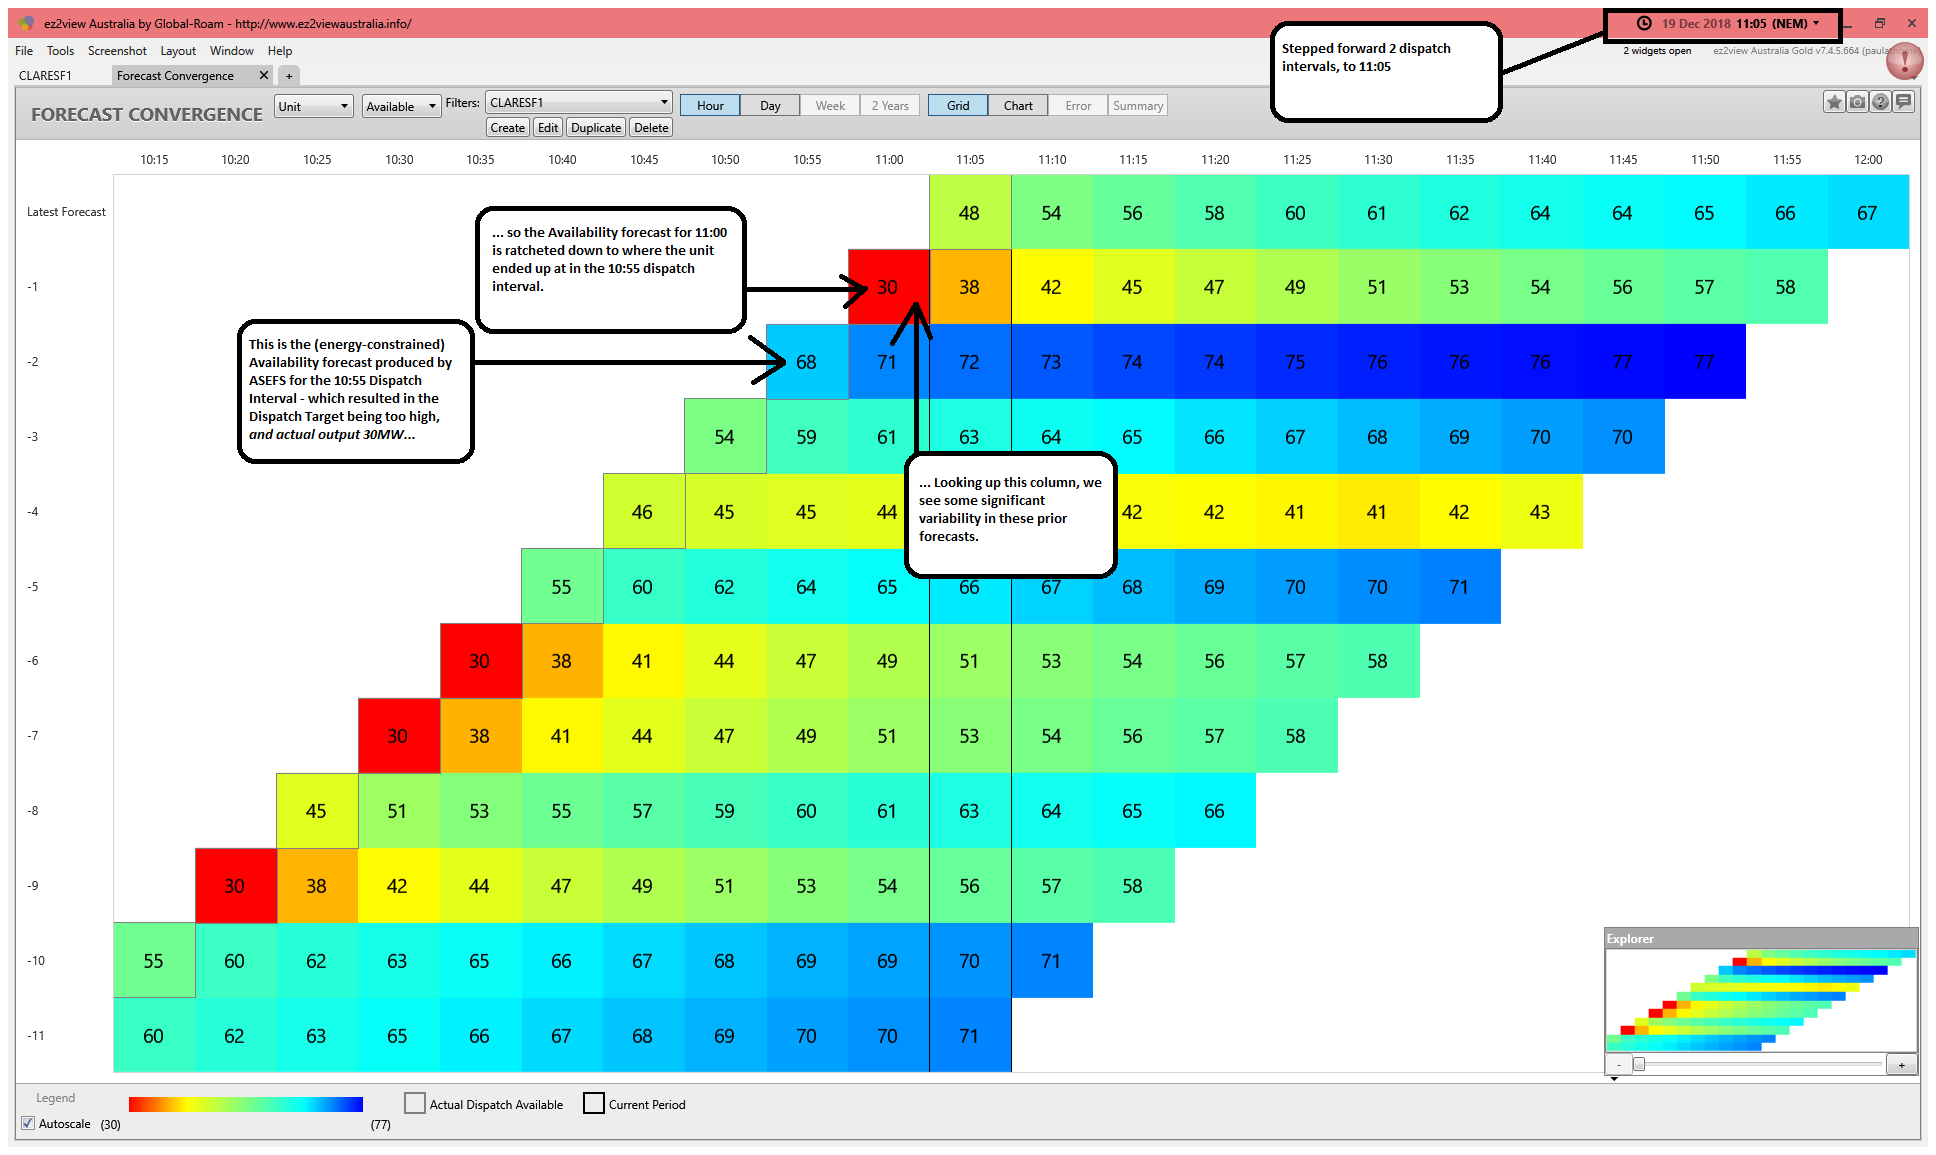
The top-left corner of the graph is blank, because these would be "predictions" of the past (which do not exist). The bottom-right corner is blank because these are predictions of the distant future, which do not exist. (Or at least, not in this MMS table, which only goes out one hour. For predictions further out, see the price prediction section further down.) Every 5 minutes, AEMO publishes a new set of predictions, which appear as a newly inserted row up the top of this graph. Each row is shifted one interval to the right, because the start and end of the predictions are for intervals which will occur 5 minutes later.
For example, the third row is mostly blue (relatively high values). This means that around 10:51 (2 intervals before the one ending at 11:05) AEMO predicted high prices for the next 12 5-minute intervals (10:50-10:55 until 11:45-11:50). The red "30" value at the start of row 2 shows a relatively low value. The cell below (71) is blue. This shows that the final price of 30 was a surprise (30 is far lower than 71).
If you are looking at historical predictions and wanting to know what market participants expected at a certain time, you will need to find the latest row of data in this graph (e.g. RUN_DATETIME < t in P5MIN_REGIONSOLUTION, or sometimes LASTCHANGED) and then use a different column (e.g. INTERVAL_DATETIME or SETTLEMENTDATE) to see which interval it applied to. Later on there is an example query showing this.
Watt Clarity also explain this concept.
Scheduled Vs Non-Scheduled
A "scheduled" generator is one which submits bids to AEMO, and is told what power level to produce at by AEMO, every 5 minutes. Most big generators are scheduled. Most loads are non-scheduled (you do not talk to AEMO before turning on your dishwasher). Some large loads (such as smelters) are scheduled.
A "non-scheduled" generator generates whenever it wants. These tend to be small hydro plants and biowaste generators. If you find a generator mentioned in some tables but not others, it may be non-scheduled. To find out, check the NEM Registration and Exemption List.
A "semi-scheduled" generator is a type of scheduled generator where the instruction from AEMO to generate a certain power level is a one-sided upper limit. This is for wind and solar, which are allowed to produce less after an unexpected drop in wind/sunshine, but sometimes must waste extra power when there is an unexpected increase in wind/sunshine.
Rooftop solar is none of these categories. It is treated as negative load. This is described later in the Rooftop Solar section.
What is FCAS?
"Frequency Control and Ancillary Services" (FCAS) are additional markets for non-energy products. Of course they still involve moving electrons down wires to transmit watts and joules. However the objective of these services is not to transmit energy from a generator to an consumer's device, but rather to keep the grid running. You can think of them as "reliability services".
- "Regulation" is about adjusting generated power levels to mirror the natural fluctuations in consumption within each 5-minute period.
- "Contingency" is about reacting quickly when things go wrong. e.g. When the Callide C plant had a fire, their power output dropped unexpectedly. Consequently grid frequency dropped outside the normal bounds, and other generators had to quickly increase their output to fill in the shortfall. Only some generators are physically able to do so.
In Australia, generators providing FCAS are paid for being ready. If the FCAS capacity is not needed, they are still paid. If it is needed, the only additional payment is for the increase/decrease in energy they provide, at the normal energy price. This pricing approach is discussed in my master's thesis.
Similar services in other countries are called "balancing", "mFFR", "aFFR", "FCR", "raise", "lower" etc. The problems being solved are the same, but the mappings between products are not one-to-one. For a more detailed introduction to Australia's FCAS market, see this interesting paper by Gilmore, Nolan and Simhauser about estimating the levelised cost of FCAS.
The time spans of contingency FCAS products are:
- "Very Fast" - 1 second
- "Fast" - 5 seconds
- "Slow" - 60 Seconds
- "Delayed" - 5 Minutes
The directions are:
- "Raise" - Frequency is too low. We need to raise frequency by raising generation output or lowering load
- "Lower" - Frequency is too high. We need to lower the frequency by lowering generation output, or raising load
To understand the relationship between power and frequency, see my bachelor's thesis.
In the data you will find combinations of these timescales and directions.
For example, in DISPATCHPRICE, RAISE60SECRRP is the regional reference price of the 60 second raise product.
The 1 second products were introduced relatively recently, so sometimes in the data and documentation those columns are not adjacent to the others. For data prior to 9 October 2023, those columns will be empty (or missing). If you use Nemosis and find it missing for recent data, use this trick to add it.
It seems that most academic researchers ignore FCAS, because it is technically complex. I believe this is unwise. FCAS is important, and increasingly so. For many years, batteries earned more profit from providing FCAS than energy. (See Watt Clarity.) In a world with a huge amount of zero-marginal-cost renewables, energy profits would be approximately zero most of the time. Most profit would come from the few periods of ceiling price spikes during scarcity, and from the FCAS services keeping the low-inertia system stable. If your research question is about what the future will look like, especially in high-renewables scenarios, you should consider FCAS.
There are some obscure ancillary services which are not FCAS (e.g. black start). These are typically handled through bespoke procurement on the timescale of years, and do not appear in the MMS dataset.
If you ever encounter the string ENOF, this refers to energy.
(I suspect it stands for "ENergy OFfer", but that is just my guess.
See the BIDTYPES table.)
How are Batteries Treated?
Battery data is often counterintuitive and inconsistent. I suspect this is because the rules about batteries have evolved over time. For example, the first battery (Hornsdale) is actually classified as a wind generator.
If you look at the list of registered participants (file "NEM Registration and Exemption List", sheet "PU and Scheduled Loads") you will see some assets listed with a "Dispatch Type" of "Bidirectional Unit". These are all batteries.
Although one battery (Kennedy Energy Park) is listed as a "Generating Unit" (DUID KEPBG1) for discharging, and a "Load" (DUID KEPBL1) for charging. (This particular battery is actually non-scheduled.)
Sometimes generators show negative power levels. e.g. a solar farm needs to draw a trickle of power to 'keep the lights on' during the night. (This is for the local IT systems, but also can be iron losses in the transformer.) Less intuitive is that loads can have both positive and negative values. I still do not understand why this can happen, especially for a bidirectional unit which has been split. In these cases I tend to try to use heuristics to figure out the convention. (e.g. is the sum of negative values larger or smaller than the sum of positive values? Do I expect this DUID to generate/consume more, a lot less or slightly less than it consumes/generates).
As more and more sites colocate wind/solar with batteries (despite the lack of spot revenue benefit), analysing the data for these will become increasingly difficult.
Wholesale Demand response
The NEM does have a formal demand response market at the wholesale level. ("Wholesale Demand Response", or "WDR".)
The point of electricity retailers is that they hedge consumers against volatile spot prices. The purpose of the WDR market is to let consumers re-expose themselves to the spot market, selling "negawatts" at high spot prices. It is simple in theory, but complex in practice.
In terms of the data, you may see WDR participants (including aggregators) in the data where you expect generators. Since these are not real megawatts, you often need to drop these rows. e.g. If you want to find the fraction of energy generated by a particular fuel type, you should exclude WDR values in the denominator, because that energy is not real, it is counterfactual.
In practice the total volume of the WDR market (and other demand response schemes too) is smaller than other countries.
Constraints
In Economics 101 we are taught that price and quantity is set by the intersection of supply and demand curves. In electricity markets the aggregate supply curve is explicitly uploaded to the market operator (e.g. AEMO). The market operator also has the demand curve from scheduled loads, and they add a prediction of unscheduled load (i.e. most load) at the ceiling price for the rest of the aggregate demand curve. However the intersection of these two curves is rarely the actual price. In practice we are physically unable to get power from the cheapest generator to the marginal consumer. (If we always could, it means we are spending too much on network infrastructure.)
Sometimes this is because transmission wires only have a certain maximum capacity. Sometimes there are other more complicated constraints about voltage, fault levels, inertia etc.
AEMO accounts for these directly in their decision, as algebraic constraints considered by linear optimiser software. (This is a much more efficient approach than the typical European one, where constraints are ignored during bid clearing, then adjustments are made afterwards to account for them.)
Australia's grid is much more constrained than most grids. This is probably because it is very large and the population density is low. For many research questions, you should be considering constraints. If you see something unexpected in the data (e.g. generators bidding far below their marginal cost), you should ask yourself whether it is because of constraints.
Information about whether constraints bind each interval (or are forecast to bind) is in the data. This data tends to be very large. Only download it if you need it.
Understanding constraints is very difficult.
e.g. what does F_I+ML_L5_0400 mean?
The table GENCONDATA describes what each constraint is about.
However the descriptions are quite difficult for the uninitiated to understand.
AEMO has built a tool to explain each constraint in plain English.
Unfortunately this is only available to market participants, not researchers.
GENCONSET and GENCONSETINVOKE contain data about when constraints are "invoked".
"Invoked" means that it is considered by NEMDE.
"Binding" means that the limit has been hit, and it is actively preventing a more economically efficient dispatch solution.
A constraint which is invoked but non-binding happened to have no effect.
If you see Out = Nil, that means that this constraint is invoked when there is no outage. i.e. it is invoked the majority of the time.
Constraints with names that start with a # are private. Only one generator is impacted, so the details are not published, or not published live.
Green Products
"Large-scale green certificates" (LGCs) are a form of renewables subsidy for large renewable generators. In Europe these would be called "guarantees of origin". Each eligible generator earns one certificate per MWh generated, which they can sell. Retailers and large loads have an obligation to buy a certain amount each year, which drives the price up. AEMO's MMS data does not include LGC prices. (Although of course the price of LGCs drives bidding behavior. If you are trying to understand wind/solar bidding, you must consider LGCs.)
"Small-scale technology certificates" (STCs) are subsidies for smaller installations (typically rooftop solar). A wide range of subsidised and unsubsidised feed-in tariffs for rooftop solar exist, varying by region and installation age.
Unfortunately Australia does not have a carbon price. To the best of my knowledge, we are the only country to ever repeal a carbon price. (Arguably the carbon price cost the Gillard government the election in 2013.)
Other Terms and Acronyms
LOR stands for "Lack of Reserve".
This is a prediction by AEMO that standard market clearing may not provide enough energy, resulting in load shedding.
In most cases the market reacts to this prediction (e.g. cancelling generator maintenance outages to generate at high prices), so the feared outcome rarely happens.
This is described more in this Hachiko article.