How to Query and Understand the Data
Units
If no units are specified in the schema documentation or the column name itself,
power is usually megawatts (MW), and energy is megawatt hours (MWh).
Deduplication
The MMS dataset has hundreds of tables.
Some of them are append-only (e.g. DISPATCHPRICE).
For some reference data the same dataset is republished every month, so that you can still have a usable dataset if you only download the latest month of zip files.
For some data, some or all rows change regularly, in a way where they should overwrite previous rows.
This is only a minority of tables. (AEMO normally errs on the side of providing higher-dimension data with version history).
So you should deduplicate to grab the latest row for each entity. (e.g. sort by column LASTCHANGED then take the first row for each group of primary keys.)
One of the main benefits of PDR Loader is that it will do this insert/update for you. If you are doing something else (e.g. Nemosis) then I recommend doing some exploratory queries to check whether the unique primary keys are indeed unique.
The schema documentation lists "Primary Key Columns" and "Index Columns" for each table. Using Pandas/Polars/SQL you can deduplicate based on those. (Typically you should choose the one with the latest LASTCHANGED value.)
I have seen one particular month where the CSVs for some tables overlapped with the prior month by one interval.
If you have unexpected duplicates, check for an INTERVENTION column.
Missing Data
If you find a table in the schema documentation for which you cannot find the data (or it appears empty), it may be only published privately. (e.g. each generator sees the data for themselves. The public files are empty.) Sometimes the public/private classification applies in a row-wise way. (e.g. some constraint data is private.)
To find out if a table is public, check the documentation for that table. You can also check the list of monthly MMSDM files. Most (but not all) public tables appear there.
Sometimes columns are always empty. This could be because they have been deprecated, or maybe they will be populated in the future. Sometimes you just need to look at the actual data to find out if it is empty.
Sometimes data is just missing for one table for one month. (It may be present for the prior and subsequent month.) Different tables only go back historically to different starting points. This may be because that is when the relevant rules or schema changed.
If you cannot find data for a particular generator, that may be because it is non-scheduled.
Understanding Timestamps
Tip
Timestamps generally refer to the end of the period, not the start.
e.g. a SETTLEMENTDATE of "2025/01/02 03:05:00" refers to the period from 3:00 to 3:05.
Pay attention to the documented definition of each field. For some power values it is the average across the 5 minute period. For most power values it is an instantaneous power value at the end or start of the period.
INITIALMW refers to the power at the start of the period. TOTALCLEARED refers to the power at the end of the interval.
"Cleared" refers to what AEMO instructs or predicts. AEMO's plan is that generators will take the entire period to adjust their output, linearly.
This is described in more detail in my thesis.
Some fields are logically dates not datetimes. However they will still appear in the data as datetimes, at midnight at the start of the day.
Timezones
Tip
All timestamps are in "market time", i.e. Australia/Brisbane, UTC+10, with no daylight savings.
This is true even for data which applies to regions in other time zones.
(Note that if Queensland ever adopts daylight savings, it is likely that a lot of IT systems in the electricity sector will break in a Y2K kind of way, because many people configure the timezone as Australia/Brisbane when it is technically supposed to be UTC+10.)
5 vs 30 minutes
The NEM operates on a 5 minute schedule. This was not always the case. Prior to October 1st 2021 there was a mix of 5 and 30 minutes. Bids were submitted with 5 minute granularity, and were evaluated every 5 minutes, to produce a "dispatch price" every 5 minutes, and tell generators what power level to generate at every 5 minutes. However generators were paid based on the half-hour average of 6 5-minute prices, called the "trading price". (This was a historical design choice, from when computers were less powerful.) This led to some perverse distortions, where after a ceiling price event (e.g. + 15,000 $/MWh), every generator would bid to the floor (- 1,000 $/MWh) for the remainder of the half hour, because the average would still be very high. So if you are querying data from prior to October 1st 2021, check each table to see whether the frequency of rows changes to half-hourly back then.
Even today, some tables still have a half-hour granularity. (e.g. some price forecasts, and rooftop solar power). So always check the data before writing your queries.
Region ID
Regions are the geographical states of the NEM.
QLD1: QueenslandNSW1: New South Wales and the ACT, lumped into one region (same price)VIC1: VictoriaTAS1: TasmaniaSA1: South Australia
Note that all the regions end in 1. If you find your query returns empty results, make sure you did not filter by just NSW, but instead NSW1.
This 1 is because they thought that one day in the future regions might be split up.
Most tables have only those 5 values.
Some of the tables for rooftop solar (e.g. ROOFTOP_PV_ACTUAL) also contain QLDC, QLDN, QLDS, TASN and TASS (not TASC). My guess is that these are Central, Northern and Southern Queensland/Tasmania.
Some tables (e.g. BILLING_CO2E_PUBLICATION) also have NEM to refer to the sum of all regions.
Warning
Sometimes generators 'move' between regions.
There used to be a SNOWY1 region. This was merged into NSW1 many years ago.
On another occasion, AEMO typed data in incorrectly, and then corrected it by appending a new entry.
So you need to be careful when deduplicating to get the latest data, in bitemporal tables.
(For some reason the old entry has a LASTCHANGED for a date several years after the mistake was fixed.)
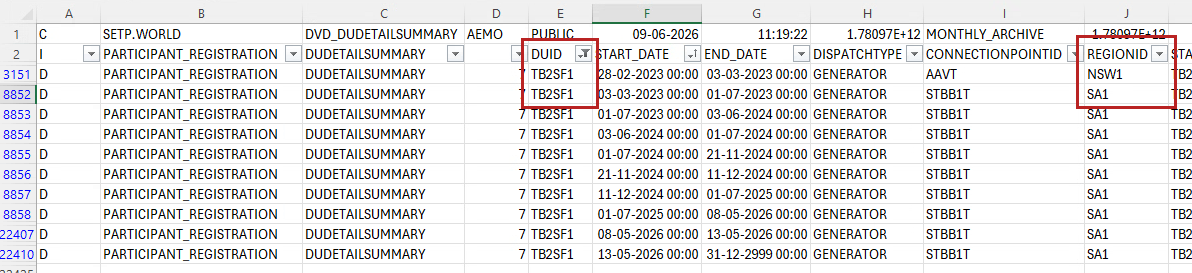
Note that the Murray Hydro plant is physically in New South Wales, near the border, but in the data as being in Victoria.
DUID, Genset ID etc
DUID is the identifier for each generator, battery, and scheduled loads.
Warning
Watch out: DUIDs (generator identifiers) may contain funny characters such as / and #, which might need to be escaped
For some data you have different granularities.
- "Participant" is the highest level entity. This is a legal corporation, which may own several generators and retailers. Although note that a single company like AGL may actually have many
PARTICIPANTIDs (AGLPARFQ,AGLSHYDR,AGLEetc), probably reflecting different holding companies/special purpose vehicles. - "Station" is a generator, in the common-sense understanding. e.g. there would be one wikipedia page per station.
DUIDis a dispatchable unit. Most market data is at this level.- "Genset" (
GENSETID) is a part of a dispatchable unit.
For example, the Coopers Gap Wind Farm has STATIONID = COOPGWF, containing one DUID (COOPGWF1). This contains two GENSETIDs (COOPGWF1 and COOPGWF2). Until 2024, the PARTICIPANTID was AGLPARFQ, i.e. AGL. Then it changed to COOPGWF. (This is a good example of how seemingly static reference data can change over time.)
Relevant tables for joining these together are DUDETAILSUMMARY, DUDETAIL, DUALLOC, STATION, STATIONOWNER.
Most stations have only one DUID. Most DUIDs have only one Genset.
DUDETAILSUMMARYmapsDUIDtoSTATIONIDandREGIONID(manyDUIDs to eachSTATIONID, and manyDUIDs to eachREGIONID). This contains a lot of other useful data (e.g. loss factors), so should be the first place you look to join these things.DUALLOCmapsDUIDtoGENSETID(many to one).STATIONmapsDUIDtoSTATIONID(many to one), althoughDUDETAILSUMMARYdoes the same.PARTICIPANTIDmaps eachSTATIONIDto aPARTICIPANTID(many to one), although you can get this information fromDUDETAILSUMMARY.
Note that these tables for joining IDs have a version history, so you should deduplicate to the latest record (sort by EFFECTIVEDATE descending then LASTCHANGED descending then take the first row in each group, or join with the timestamp).
Intervention
AEMO takes all generators' bids, transmission line constraints, demand forecasts etc, and they plug it into a big linear optimiser called the NEM Dispatch Engine (NEMDE), which finds the economically optimal solution. (e.g. Maybe the grid cannot get power from the cheapest generator to the consumer, so a more expensive generator elsewhere is used instead.) Sometimes the complexity of the electrical grid cannot be represented nicely in mathematics. In those cases AEMO manually intervenes to tweak the results. This situation is called "Intervention".
When this happens, many tables contain both the pure-math result, and the actual result.
Note that interventions are related to constraints in the grid.
INTERVENTION=0rows are from the "pricing run". This run is done as if AEMO did not manually adjust anything. This data is used to determine the prices which generators are paid.INTERVENTION=1is the "base case" run. This includes AEMO's manual adjustment. This data contains the actual power targets for generators.
Interventions are rare, but the values in INTERVENTION==1 rows may be drastically different to the INTERVENTION==0 rows.
Tip
If a table contains an INTERVENTION column:
- you should get prices from rows with
INTERVENTION == 0; and - you should get power and energy from rows with
INTERVENTION == 1if present (otherwiseINTERVENTION == 0).
For prices, this is as simple as WHERE INTERVENTION == 0 (for SQL) or .filter(pl.col("INTERVENTION") == 0) (Polars).
For power, you need to find the maximum value of INTERVENTION for each tuple of primary keys.
There are several ways to filter by the maximum value of a column. One way in Polars is:
lf.filter(
    pl.col('INTERVENTION') == pl.col('INTERVENTION').max().over(['SETTLEMENTDATE', 'REGIONID'])
)
Note that this kind of step can substantially increase the memory footprint of your query. For large tables, you may need to think carefully about how you do this, if you are running out of memory.
There may be exceptions to this rule of what to filter by.
For example, rooftop solar power estimates have an INTERVENTION column.
However they are not dispatched, so there should not be a difference between the two cases anyway.
More detail can be found in NER rule 3.9.3 and AEMO's Intervention Pricing Methodology.
If you find 'out of merit' dispatch happening, directions are one reason why. e.g. A huge amount of gas generation in South Australia happens when the price is below the gas generators' bid/cost, because there is a requirement to always have a minimum amount of gas generation running. (As an aside, this metric is crudely defined, and this limit drastically limits the decarbonisation impact of additional solar and wind, yet was notably absent from the recent political discussions about nuclear power.)
Intervention scenarios happen when AEMO issue a "direction" (see NER rule 4.8.9). However not all directions result in intervention pricing.
RRP
Tip
RRP is the energy price.
It does not stand for "Recommended Retail Price". It stands for "Regional Reference Price".
ROP is the "Regional Override Price".
This is a counterfactual price which was not used because some adjustment was made.
Within a region (e.g. within NSW), transmission constraints may hinder the ability to transmit power from one generator to a load in the same region. "Local prices" incorporate transmission constraints to provide the theoretical marginal cost of increasing power at each node in the network. However (for now) generators are not paid this price. This price is useful only to understand why generators may be constrained on (forced to generate even when paid less than their bid) or constrained off (forced to not generate even though their bid is lower than what they will be paid). The controversial "COGATI" proposal is to transform the NEM into a nodal network, such that generators are paid the local price, not regional price. That interesting debate is outside of the scope of this article. Just note that this has not come into effect at the time of writing (late 2025), and is unlikely to be implemented within the next few years.
You can find an explanation of price setting in Watt Clarity.
Interconnectors
Interconnectors are the transmission links to provide import/export between the regions. Sometimes they are the kind of transmission line you would expect, with a few thick wires strung between a line of towers. Sometimes they are more of an abstraction over several smaller lines, as a "hub and spoke" simplification.
Interconnectors are bidirectional. The convention for the sign and direction is:
Tip
Positive export values mean that power is flowing away from Tasmania.
TAS1toVIC1VIC1toSA1VIC1toNSW1NSW1toQLD1
Negative values mean power flows in the opposite direction.
“For interconnector values, negative and positive signs indicate the direction of flow. Positive values indicate flows north or west e.g. TAS to VIC, VIC to NSW, NSW to QLD, VIC to SA. Negative values indicate flows in the reverse direction." - AEMO Data Dashboard
Losses
You may see terms such as "marginal loss factor" (MLF), "transmission loss factor" (TLF) or "distribution loss factor" (DLF).
Even within one region, power generated by one generator will be partially lost in transmission before reaching the consumer. The purpose of MLF and TLF is to account for this. The real grid topology is very complex, so AEMO models the grid as a "hub and spoke" model, where all loads and generators are directly connected with individual, lossy lines to an imaginary central reference node within each region.
Loss factors are typically slightly smaller than 1. Sometimes they are exactly 1 (e.g. a generator connected directly to the transmission network instead of a distribution network will have a DLF of 1.) In rare cases they may be slightly above 1 (e.g. when a generator in a load center alleviates constraints).
TOTALCLEARED, DISPATCH_UNIT_SCADA, UIGF and INITIALMW all reflect power at the site, before loss factors are applied. When looking at bidding data, bid volume (MWh) reflects power at the site, and prices reflect the price at the local node. You must multiply the bid price by loss factors to get the regional price.
This is described in more detail in Watt Clarity.
This is a different concept to Australia's nodal dispatch, regional settlement process (where "local price" may differ from the regional price). For more information about that concept, see AEMO's Guide to Mis-Pricing Information
TRK Tables
There are many table names ending in TRK.
These contain metadata about version history.
(e.g. STATIONOWNERTRK contains version history metadata for STATIONOWNER.)
You probably do not need to look at the TRK ones.
Bids
Bidding data is quite difficult to query, mostly because it is a tremendously large volume. (Terabytes, when in uncompressed CSVs.) So if you are planning on using some simple Pandas code, think again. You probably need something more advanced. (Polars on a laptop might be sufficient, if you are careful with memory management. I listed some tips earlier.) I might write another blog post focusing on bidding data. Let me know if you are interested. For now, here are some preliminary notes.
I already described some of the timing and structure of bids in an earlier section.
The relevant tables are BIDDAYOFFER, BIDOFFERPERIOD, BIDPEROFFER_D, BIDDAYOFFER_D, BIDPEROFFER.
- All bids are published, publicly, but with a delay or one or two days.
- Since bidding data is large, it is often split into many files on Nemweb. This splitting process varies across time. So you must enumerate the file list from the parent URL before downloading them. (Thankfully the HTML on that file list web page is very parse-able and stable.)
- If a generator wants to rebid one interval, they must re-submit a file for every interval of the day (including intervals in the past). This ends up in the data. So there is a huge amount of duplicated data. AEMO have started publishing only the rows which change. They have done this since I last worked with bidding data closely, so I do not know the details. I suspect that the tables or files with names ending in
_Dare the deduplicated ones. (Perhaps the distinction only exists in the files on Nemweb, and not in the schema documentation.) - For every rebid, one row (per rebid, per generator) appears in
BIDDAYOFFER(with timestamps, rebid reason, rebid category and price bands), and then many rows (one per interval of the trading day) appears inBIDOFFERPERIOD(with ten columns containing the bid volumes for each band).BIDOFFERPERIODis the extraordinarily large table. - Since 5 minute settlements were introduced, the bid metadata has expanded to many more timestamps.
- AEMO allows generators to submit bids which do not comply with the timestamp specification. So every millionth row may cause an error when you are using
strptime. - Similarly, AEMO does not validate/coerce the rebid reason. I have seen a few bids out of billions of rows which use a lowercase
f, instead of the standardF. So if you are trying to use an enum to optimise your code, you will get an error when processing such rows. So coerce this string into uppercase before casting it to an enum. - Some of the bidding data contains millisecond granularity, so the datetime string format is different to other datetimes in the MMS dataset. - Some bidding fields contain a time without a date. Sometimes it is ambiguous which date it is, so you must guess with heuristics. This was an oversight (by the AER not AEMO, as far as I am aware).
- The CSVs from AEMO are compressed. If you convert to Parquet, that is also compressed. Compression works well for things like timestamps and DUIDs, which repeat or overlap a lot. However for rebid reasons, these are long strings which may vary a lot. Therefore I suggest that unless you know you will need them, you should drop the
REBIDEXPLANATIONwhen converting from CSV. You should still keep theREBID_CATEGORY, which is a single character. This is good enough for most purposes. The human-readable explanation sentence is hard to do any automated analysis on. - Bidding data includes FCAS. If you do not care about FCAS for your analysis, you should filter to only include
BIDTYPE = ENERGY. If doing this when converting from CSV to Parquet, you will save a lot of space.
Warning
Sometimes the filenames for bidding data files on Nemweb are for a different bidding table to the contents of that file.
Check the column names against the schema documentation to confirm which table it is.
If you want just the price bands for a given day, find the row in table BIDDAYOFFER with the largest OFFERDATE, for a given tuple of DUID, BIDTYPE, DIRECTION, DUID, SETTLEMENTDATE.
If you want to look at the actual bid volumes, use BIDOFFERPERIOD.
TRADINGDATE is a date (even if it looks like a datetime), referring to the trading day, which goes from 4:00-4:05 am to 3:55-4:00 am the next calendar day. So this does not align to calendar days.
You should construct a datetime at 4am on that date, then add 5 minutes multiplied by PERIODID.
Then you must delete rows in the past (OFFERDATETIME >= INTERVAL_START).
Then to deduplicate, find the row with the largest OFFERDATETIME for each DUID, BIDTYPE, INTERVAL_START. Note that this last step requires a lot of memory, even if you deduplicate each month individually. (I err on the side of caution by deduplicating on a per-month basis, not per file, if there are many files per month.)
Then join each row with BIDDAYOFFER to get the 10 price bands that each of the 10 volumes corresponds to.